The death toll for Super Typhoon Haiyan is expected to climb over 10,000. Here is an in-depth look at the power of Super Typhoon Haiyan.
Super Typhoon Haiyan, called Yolanda in the Philippines, was the 13th named storm of the 2013 Pacific typhoon season and is now unofficially the strongest recorded tropical cyclone to make landfall. It likely hit the central Philippines with sustained winds around 180-195 miles per hour (mph) with wind gusts near 225 mph on November 7, 2013. Today, in the aftermath of the storm, the Philippines is facing some extreme challenges. It’s now estimated that over 10,000 people are dead with many more missing. A tropical disturbance has been pushing through the country today (November 12, 2013), providing heavy rains and gusty winds. Although this system is not strong, it is disrupting recovery efforts. A big worry now is disease, as dead bodies remain on roads, bridges and in the rubble. Finding fresh water and food to the disaster areas present a major challenge, and these problems are bound to continue for several weeks if not months. Follow the links below to learn more about Haiyan.
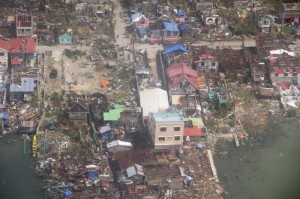
Haiyan’s the northern eye wall – bringing the strongest winds and rains – battered the city of Tacloban (population over 200,000). The storm surge there was 15-20 feet. Tacloban was heavily devastated and has been chaotic since Haiyan struck.
Animation loop showing you the extremely vivid colors and cold cloud tops as Super Typhoon Haiyan continued to intensify. The dark colors show us intense convection and the true power of the storm. Image via NOAAHow Haiyan became classified with winds of 195 mph. In the Western Pacific, we do not have hurricane hunters to fly out into storms to measure wind speeds or pressures. Since we cannot physically record these measurements, we must rely on satellite data to determine the intensity of the storm. We use a scale called the “Dvorak” technique. It uses a variety of measurements to determine the intensity of the storm. It measures the intensity of the storm from a scale of 0.0 to 8.0. A Dvorak rating of 2.0 typically shows a tropical depression (weak storm) and a rating of a 3.5-4.0 typically shows a storm at hurricane/typhoon intensity. According to NOAA: Utilizing the current satellite picture of a tropical cyclone, one matches the image versus a number of possible pattern types: Curved band Pattern, Shear Pattern, Eye Pattern, Central Dense Overcast (CDO) Pattern, Embedded Center Pattern or Central Cold Cover Pattern. If infrared satellite imagery is available for Eye Patterns (generally the pattern seen for hurricanes, severe tropical cyclones and typhoons), then the scheme utilizes the difference between the temperature of the warm eye and the surrounding cold cloud tops. The larger the difference, the more intense the tropical cyclone is estimated to be.
So why do I mention the Dvorak technique? Super Typhoon Haiyan was so strong, the Dvorak rating was around a 8.1, breaking the highest measurement typically seen. This technique estimates a storm of 8.0 to have a barometric pressure around 858 millibars (mb). Could this have been the pressure of Haiyan? We will never truly know, but the technique works, even though there are fluctuations and estimates within the classifying system. As of now, Haiyan is considered to officially have a pressure of 895 mb. Remember, the lower the pressure, the stronger the storm. The lowest pressure ever recorded in the world was from Super Typhoon Tip in 1979. Reconnaissance aircraft measured a pressure of 870 mb.
An experimental lightning detector via satellite detection noticed increased lightning activity around the eye wall of Haiyan at 2230 UTC on November 7, 2013. Image via MTSAT 2 km Infrared
read full article earthsky.org/earth/super-typhoon-haiyan
Comentarios
Publicar un comentario