
UPDATE NOV. 7, 2013, 2 P.M. CDT (20 UTC): Super Typhoon Haiyan – Yolanda, as the storm is known in the Philippines – on Thursday, November 7, became the strongest typhoon, or hurricane, of 2013. As of today, the storm had maximum sustained winds at 195 mph. That’s well above the Category 5 classification used for Atlantic and East Pacific hurricanes and just 6 mph shy of an EF-5 tornado. Plus there are gusts up to 235 mph. Haiyan is a powerful storm that appears to be headed straight across the Philippines. Evacuations are underway.Luckily, the storm does not appear to be headed for Manila, the capital and second-most-populous city of the Philippines. In Manila, which is prone to floods, the lowest alert in a four-level typhoon warning system has been issued. At this writing, Haiyan’s eye was about 200 miles southeast of Eastern Samar province’s Guiuan township. Recent forecast tracks suggest it will pass very near Tacloban, a city of close to a quarter million people, and Cebu, a city of close to one million people.
The storm has been moving at 24 mph, up from its earlier speed of 20 mph. The U.S. Navy’s Joint Typhoon Warning Center had earlier said it expected the storm to weaken as it crossed the ocean to the Philippines. Instead, Haiyan has intensified and accelerated as it moved closer to the country. Why? According to NOAA’s Visualization Laboratory, deep warm water in the Pacific has been fueling Haiyan’s intensification. NOAA said that “ideal” environmental conditions for intensification – namely low wind shear and warm ocean temperatures – exist in the Pacific now. See the orange-ish image below.
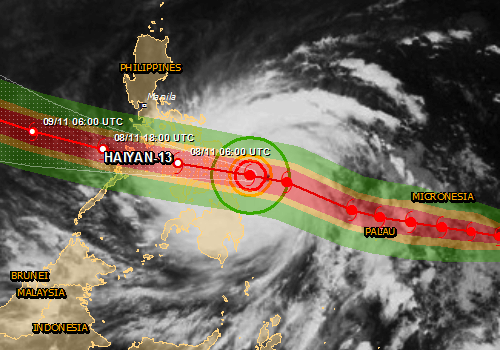
Haiyan is not expected to strike Manila directly. However, recent forecast tracks suggest it will pass very near Tacloban, a city of a quarter million people, and Cebu, a city of nearly one million people.
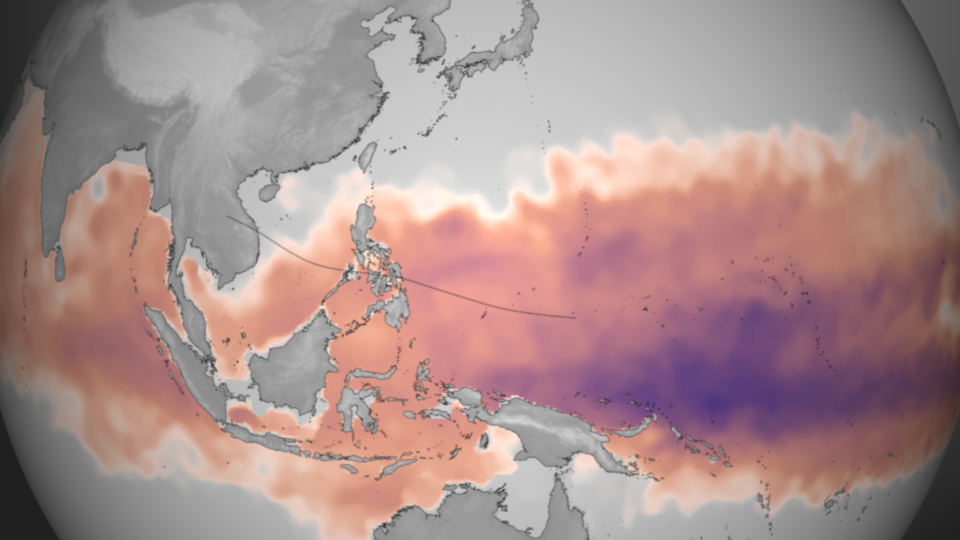
View larger. | According to NOAA, deep warm water is fueling Haiyan’s intensification. Plotted here is the average Tropical Cyclone Heat Potential product for October 28 – November 3, 2013, taken directly from NOAA View. This dataset, developed by NOAA/AOML, shows the total amount of heat energy available for [a] storm to absorb, not just on the surface, but integrated through the water column. Deeper, warmer pools of water are colored purple, though any region colored from pink to purple has sufficient energy to fuel storm intensification. The dotted line represents the best-track and forecast data as of 16:00 UTC on November 7, 2013. Image and caption via NOAA Visualization Laboratory.
source and credit a earthsky.org
Comentarios
Publicar un comentario